Spatialize and monitor agroforestry plots: contributions of satellite data and the Earth Engine platform
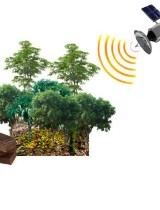
In 2021, Nitidæ launched the reference SAFART which aims to support producers engaged in a process of converting their traditional cocoa plantation to an agroforestry system. In order to facilitate large-scale monitoring of these conversions, and possibly reductions in tree cover, the use of remote sensing tools and data is essential in order to reduce costs and increase the transparency of certification. Two exploratory studies were carried out and aimed to answer the following questions: to what extent is it possible to use satellite data to spatialize agroforestry indicators measured in the field? Can the Earth Engine online platform be used to do dynamic (annual) and transparent monitoring of producers' plots?
Methodology and results
The first study aimed to explore the potential of satellite imagery (Landsat images, Sentinel 2, Sentinel 1 (radar) and Planet images) to spatialize the indicators of cocoa farms recorded in the field. For this, field indicators (structure, density, diversity, biomass) were calculated from plot inventories and satellite images were collected and prepared. A processing chain was developed using a machine learning model (random Forest). The tests were carried out on 137 inventory plots located in 4 regions of Côte d'Ivoire (Akoupé, Divo, Guéyo and Meagui). Among the 30 indicators measured in the field, some showed satisfactory correlation results with satellite images, in particular tree density, biomass and basal area. The preliminary results obtained are encouraging and open the way to other tests (new satellite indicators, other models, etc.) to improve the calibration and from other field campaigns in order to complete the learning data and validate the models.
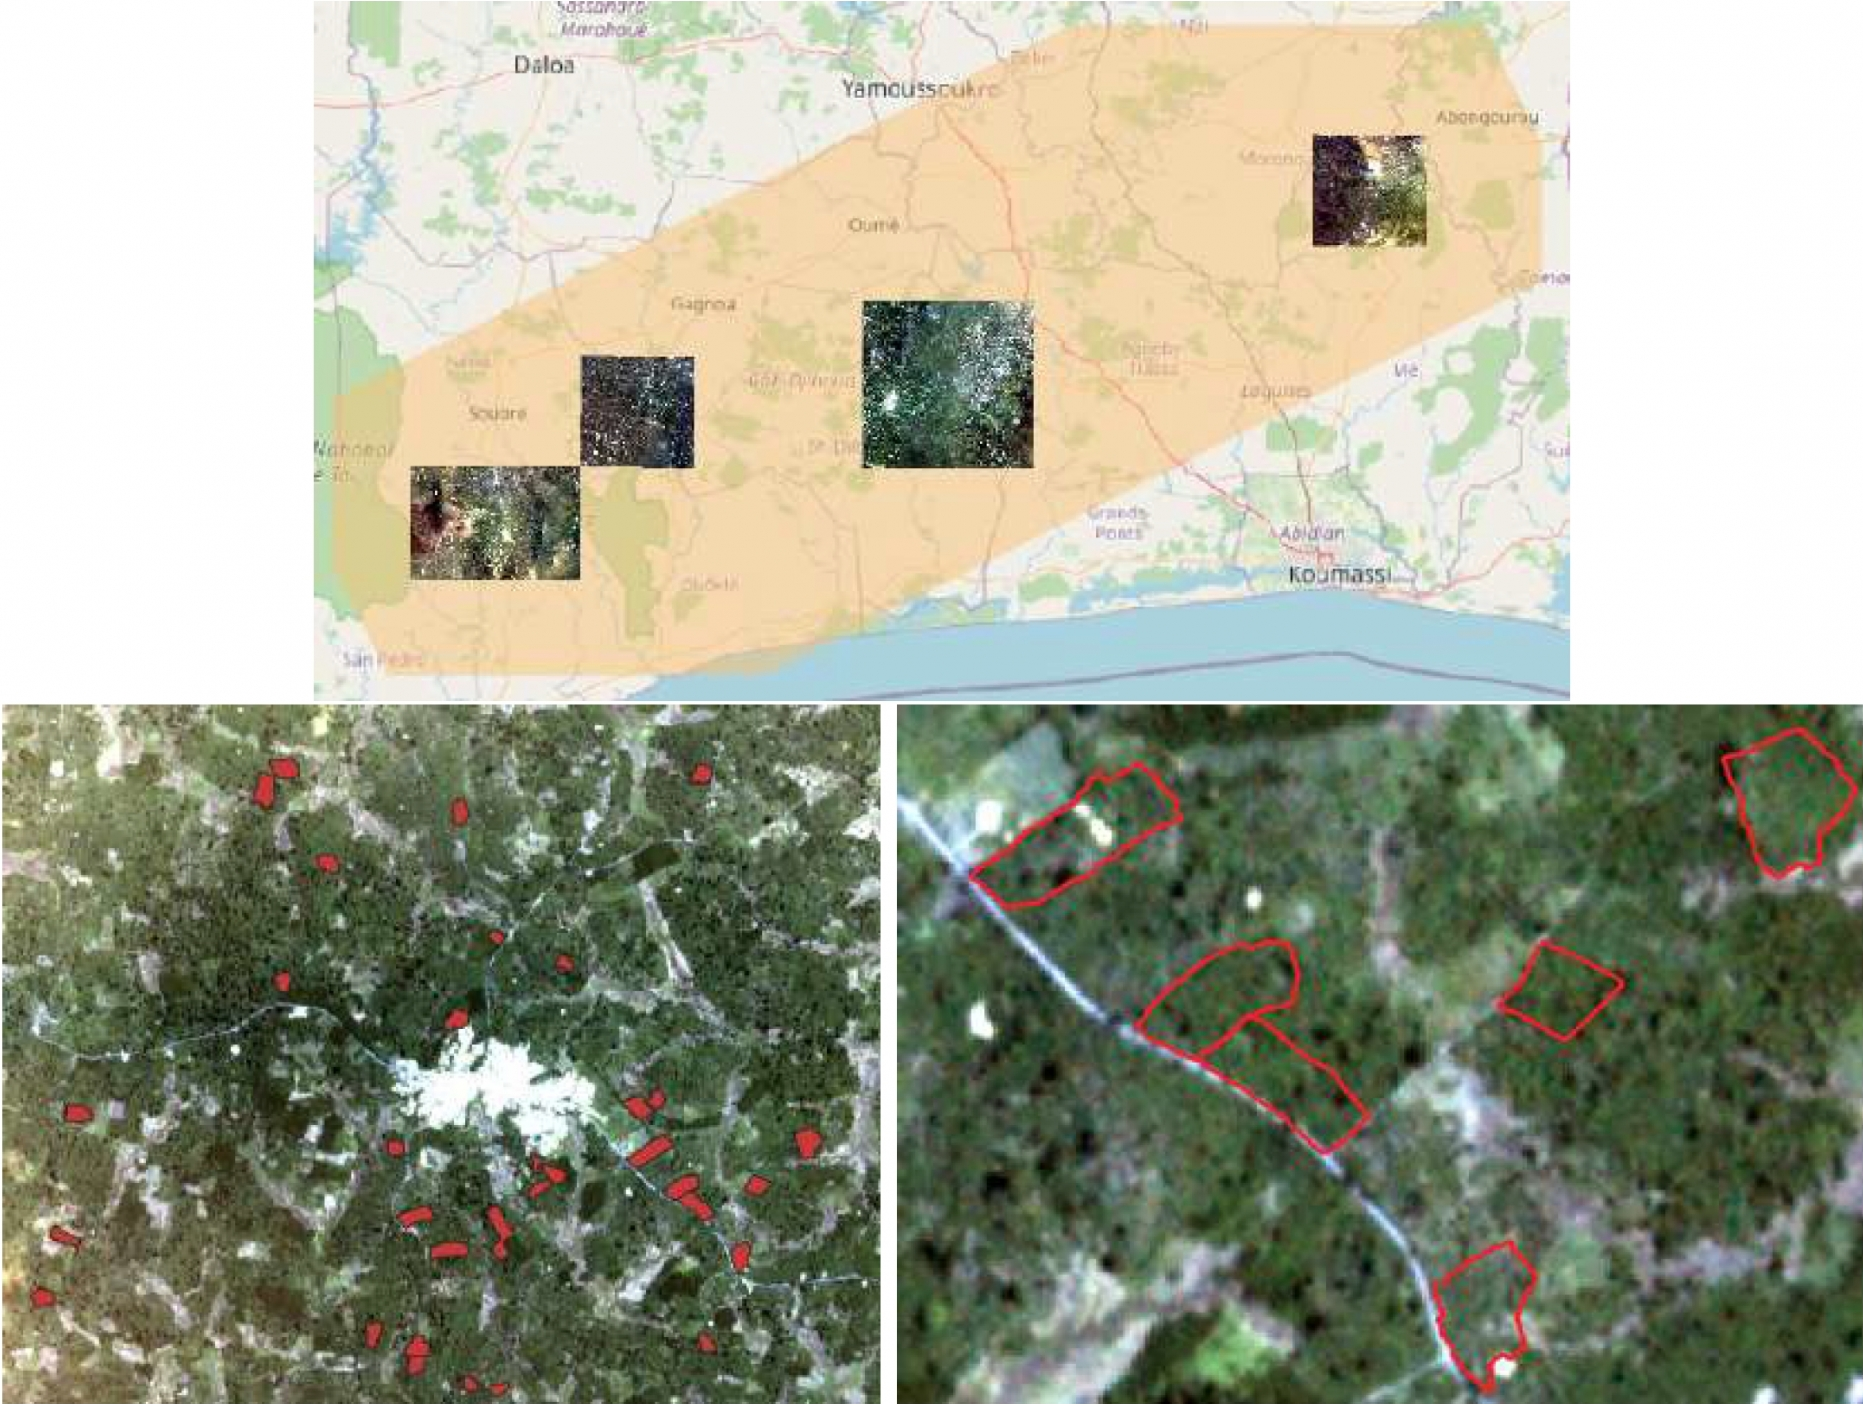
Location of the 4 study sites and visualization of the Planet images of January 2020 with the plots of agroforestry plantations
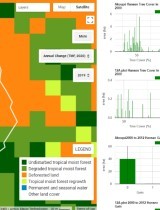
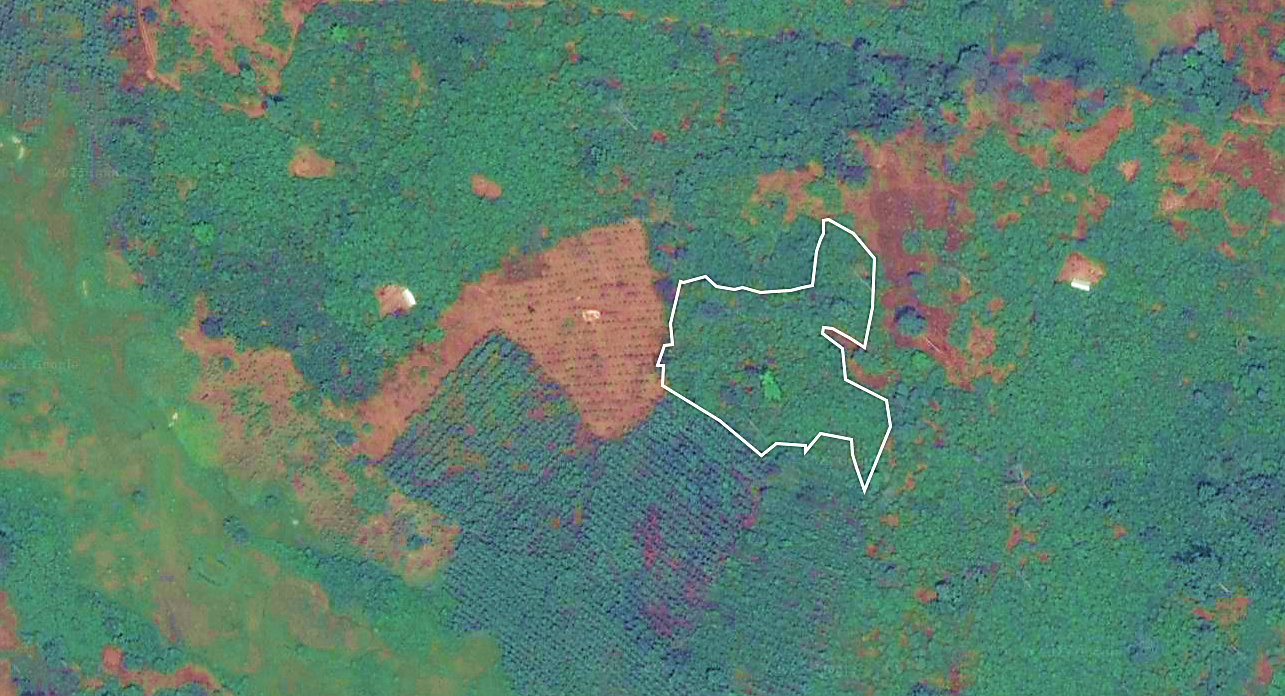
The second study aimed to develop a user interface on the Earth Engine platform in order to gather all available indicators describing the characteristics and trajectories of cocoa plots. These were global products available on the platform or national mapping studies. The choice fell on an application centered on the extraction of information from a network of plots of cocoa producers from which monitoring indicators were mapped and calculated. These indicators include tree cover in 2000, forest loss and gain since 2001 from two different data sources (GLAD, JRC), average vegetation height in 2019, canopy disturbance alerts since 2020, etc. From the contours of the plots, the statistical data (average, min, max) are calculated automatically. In addition, temporal profiles of raw satellite data are proposed in order to analyze the trajectories of the plots. A prototype interface has been created (link below) and allows both to obtain precise information (map, plot aggregated values) and to download the data (see screenshots below). Noted that this prototype is very demanding in computing resources and must be further optimized. In addition, it is planned to complete the indicators already present in the platform with spatialized data from the first works (see study above) in order to offer quality data and calibrated from inventory data.
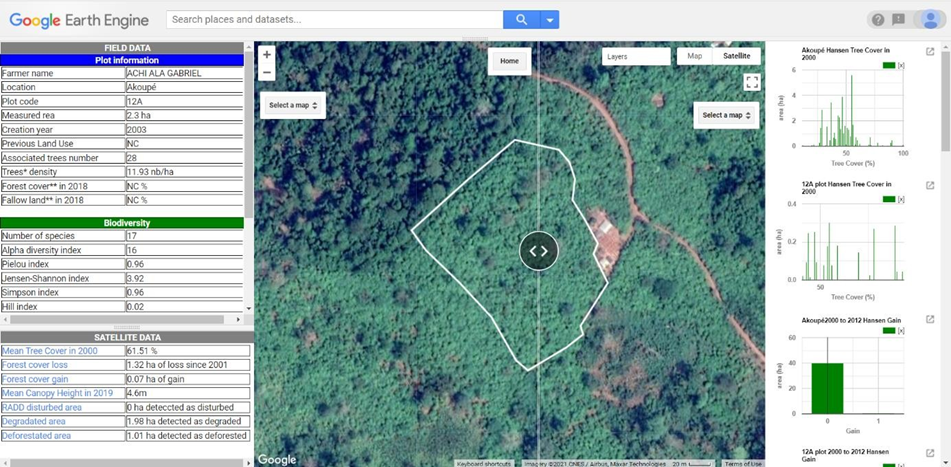
User interface with characteristics of plots measured in the field and calculated from spatial data on the left, Visualization of the plot and spatialized indicators in the center, summary graphs and time series on the right
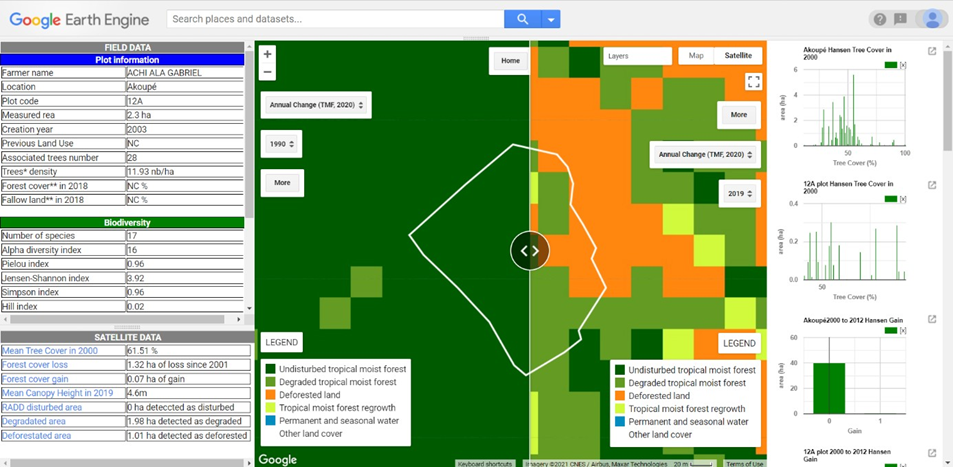
Comparison of spatialized indicators using a comparison bar, choice of dates and display of legends according to the indicator
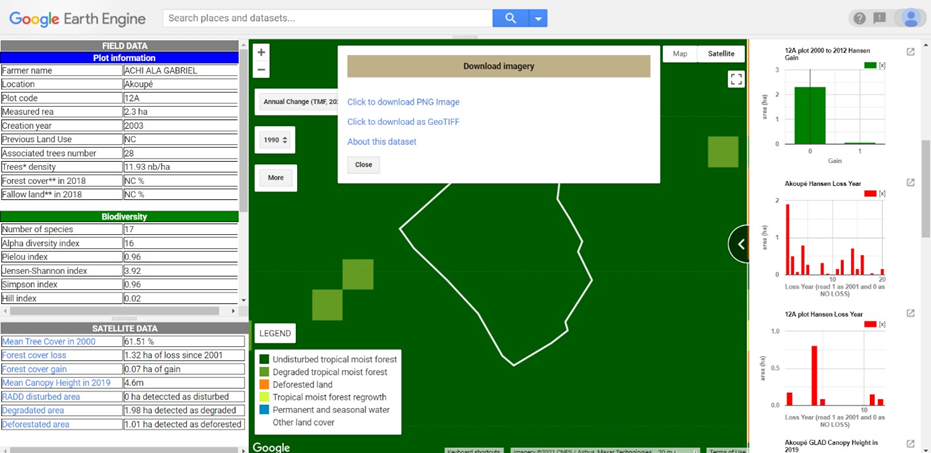
Data download function (images and statistics)
The reports of these studies are available for download below >>>
Related documents
Internship report - Development of spatial indicators for cocoa agroforestry plots in Côte d'Ivoire