Scientific paper published on methods for estimating and monitoring land degradation
A study, carried out by Nitidæ Lab and their partners CIRAD (UMR TETIS), was presented at the IGARSS conference (IEEE International Geoscience and Remote Sensing Symposium) in July 2019 and published last November in the proceedings of the conference on IEEE Xplore.
The methodology proposed by the UNCCD (United Nations Convention to Combat Desertification) for monitoring and estimating land degradation suggests expressing land degradation in terms of three sub-indicators:
(i) changes in land productivity
(ii) land cover and land use change, and
(iii) carbon stocks.
These sub-indicators can be quantified in a spatially explicit manner using remotely sensed and/or ancillary data from national databases. In the coming years, several countries will adopt this methodology to design national and local land degradation mitigation policies or programs, so it is necessary to analyze the impact of the calculation methods and data sets used on the land degradation assessment.
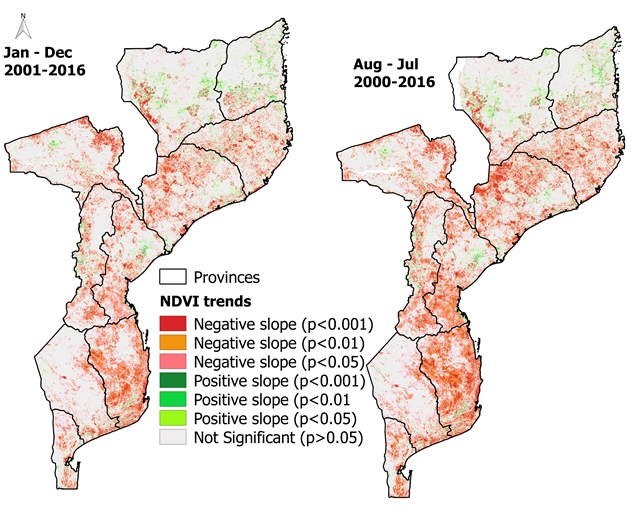
Figure 1 : Maps of NDVI annual trends calculated for Mozambique over the calendar year (January to December) and the climatic year (August to July).
This study, carried out in the Laurel project, aimed to analyze the sensitivity of the land productivity change sub-indicator to three parameters:
(i) the period of analysis,
(ii) the rainfall dataset used for climate correction, and
(iii) the annual NDVI integration period: calendar year (January to December) vs. climate year (August-July).
The results show that spatial patterns and statistics of land productivity trends differ greatly according to these three parameters, which shows that a prior analysis of the best parameters for each country is necessary and questioning the comparability of the use of this method between countries in different agro-climatic zones.
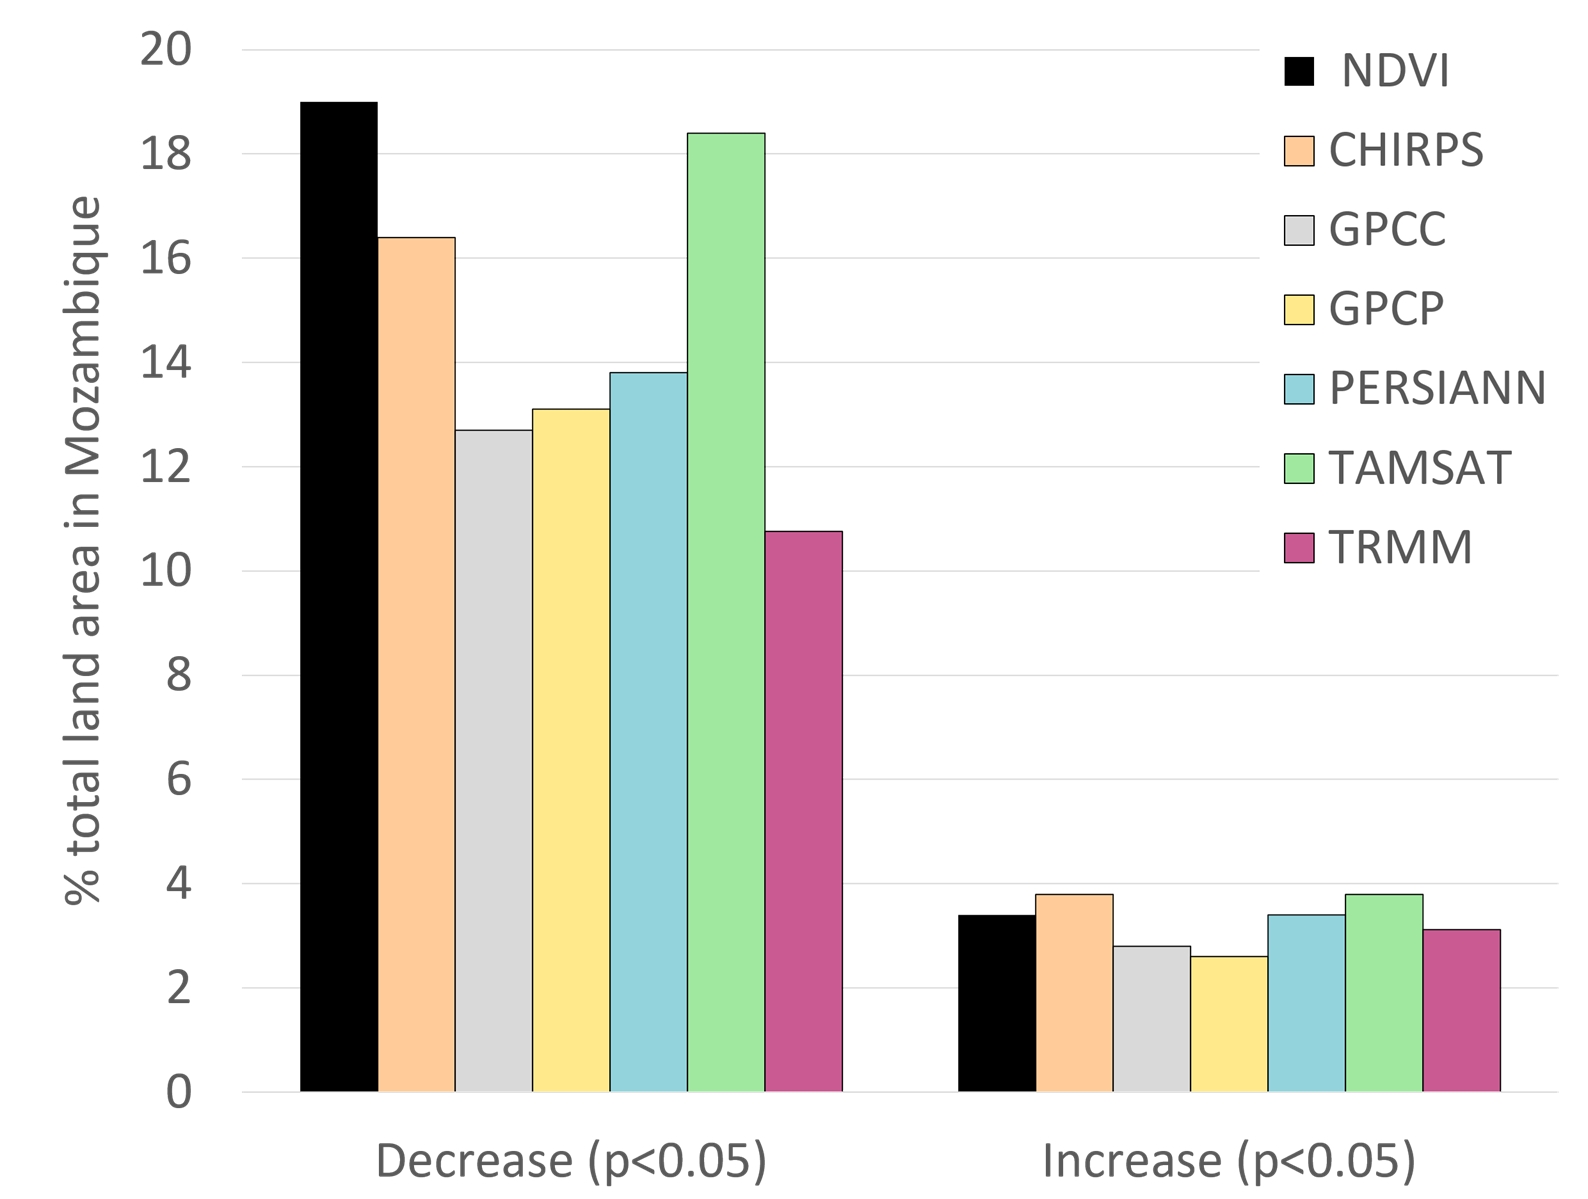
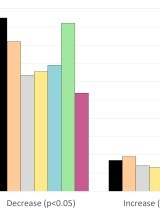
Figure 2 : Percentage of country total area showing significant decreases and increases in land productivity, calculated with different rainfall data sets over the period 2001-2016.
The paper abstract is presented below and the article is available at the bottom of the page.